Help & Documentation
Overview of RESIST
This page presents the standardized analytical results for each dataset integrated in RESIST, organized according to the four core modules of the platform:
- The Characterization Module provides harmonized cell annotations and drug-response profiling across datasets, enabling identification of resistant and sensitive cell populations, assessment of shifts in cellular composition, and visualization of tumor-microenvironment organization in both single-cell and spatial contexts.
- The Transcriptional Module defines resistance-associated differentially expressed genes, coupled with functional enrichment analyses across Gene Ontology biological processes, KEGG pathways, and Hallmark gene sets, as well as quantification of intratumoral heterogeneity (ITH), epithelial-mesenchymal transition (EMT), and drug enrichment analysis.
- The Regulatory Module investigates multilayer regulatory mechanisms through integrated analyses of resistance-associated variants, RNA-binding protein and microRNA enrichment, and transcription factor motif activity to uncover upstream regulatory drivers of resistance-associated gene expression programs.
- The Immunogenomic Module integrates post-transcriptional and immune-related dimensions by incorporating alternative polyadenylation dynamics, HLA class I genotyping, neoantigen prediction from intronic polyadenylation events, and structural modeling of neoantigen-MHC complexes.
By integrating multi-layer regulatory analyses within a unified framework, RESIST provides a comprehensive, mechanism-oriented resource for studying cancer drug resistance.
Navigation
- Overview of RESIST
- 1. Characterization Module
- 2. Transcriptional Module
- 3. Regulatory Module
- 4. Immunogenomic Module
1. Characterization Module
1.1 Cell Annotations and Drug Response Distribution
This section visualizes the cellular composition and response distribution within the dataset. Single-cell / spatial transcriptome clustering is performed using a standardized Seurat workflow, and UMAP embeddings display cells colored by Seurat clusters, annotated cell types, and drug response status (resistant versus sensitive). This enables rapid assessment of cell-type heterogeneity and treatment-associated cellular shifts.
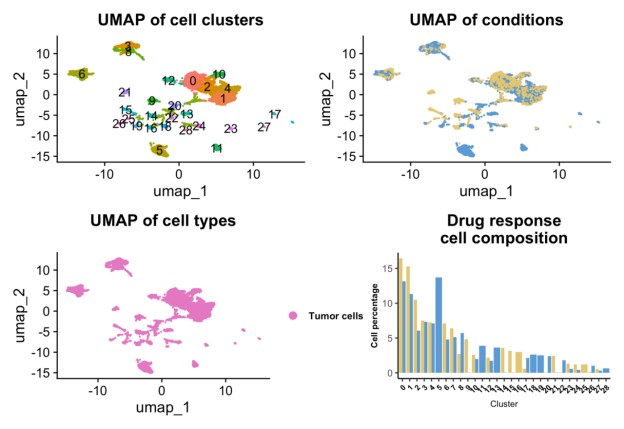
A bar chart summarizes the proportional distribution of Seurat clusters within each drug response group. Percentages sum to 100% within each response category, allowing direct comparison of relative cluster contributions between resistant and sensitive samples. These visualizations help identify response-associated compositional remodeling at the cellular level.
1.2 Spatial Distribution of Annotated Cell Types
This part visualizes the spatial organization of annotated cell types within tissue sections under different drug response conditions. Spatial transcriptomic capture spots are mapped to their physical coordinates and overlaid onto the corresponding histological images.
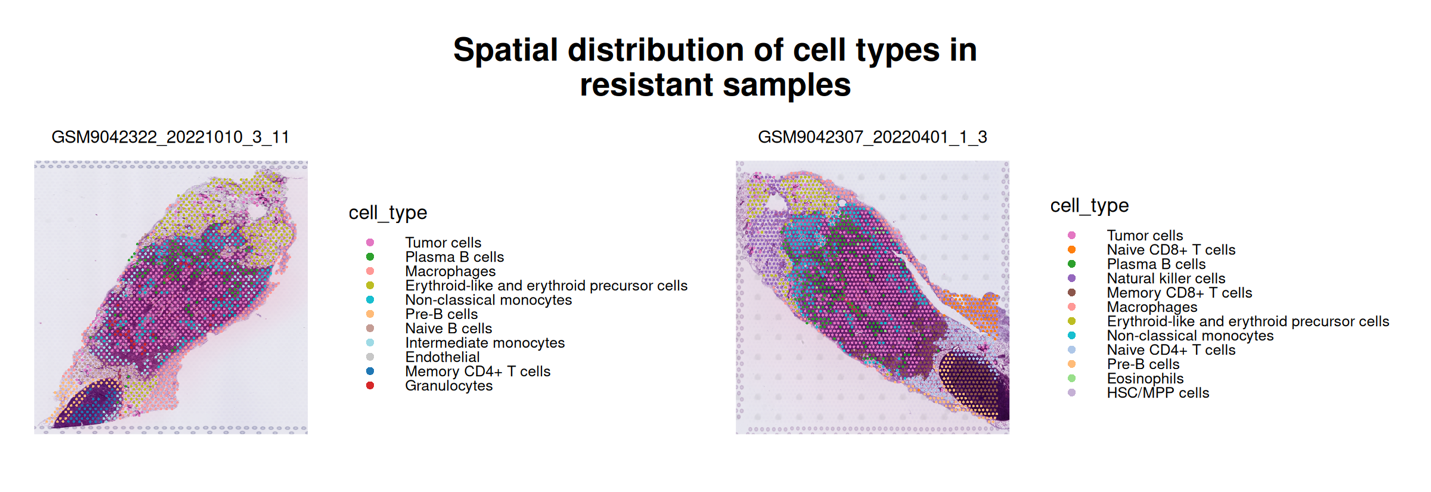
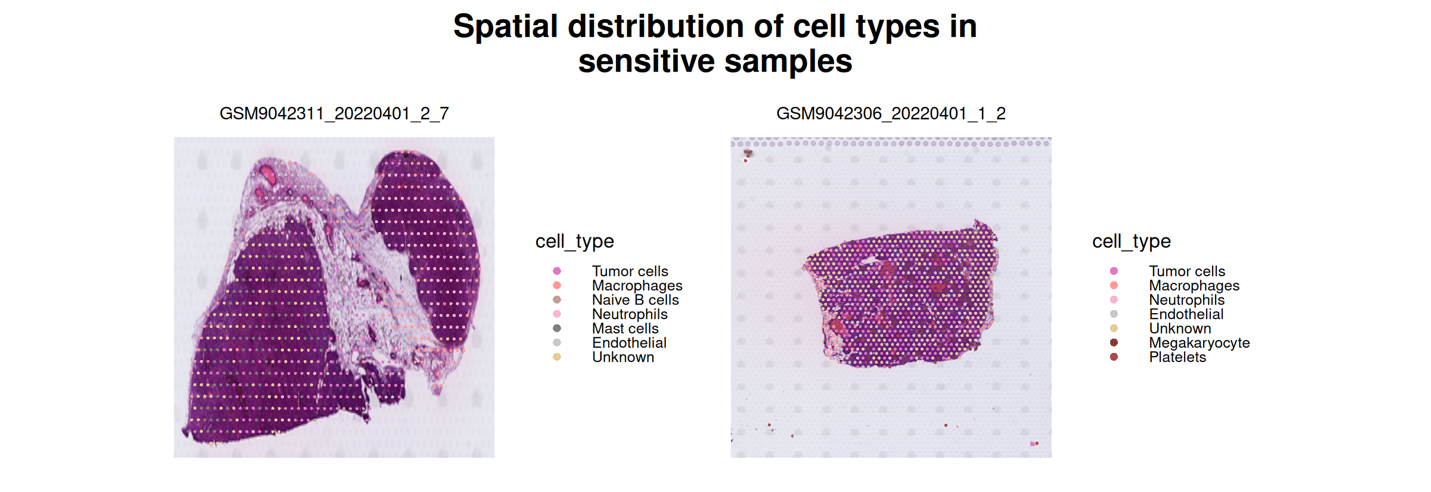
By comparing resistant and sensitive samples, users can examine how tumor cells and non-malignant populations (e.g., immune or stromal compartments) are distributed within the tissue architecture. This spatial view allows assessment of microenvironmental organization and potential structural differences associated with therapeutic response.
1.3 Cell-Cell Interaction Networks
This part presents inferred ligand–receptor–mediated communication networks separately for resistant and sensitive groups. Interaction inference is performed using curated ligand–receptor databases combined with statistical testing to identify significant signaling events between annotated cell types. Communication probability is estimated based on aggregated ligand and receptor expression across cell populations, allowing construction of condition-specific signaling networks.
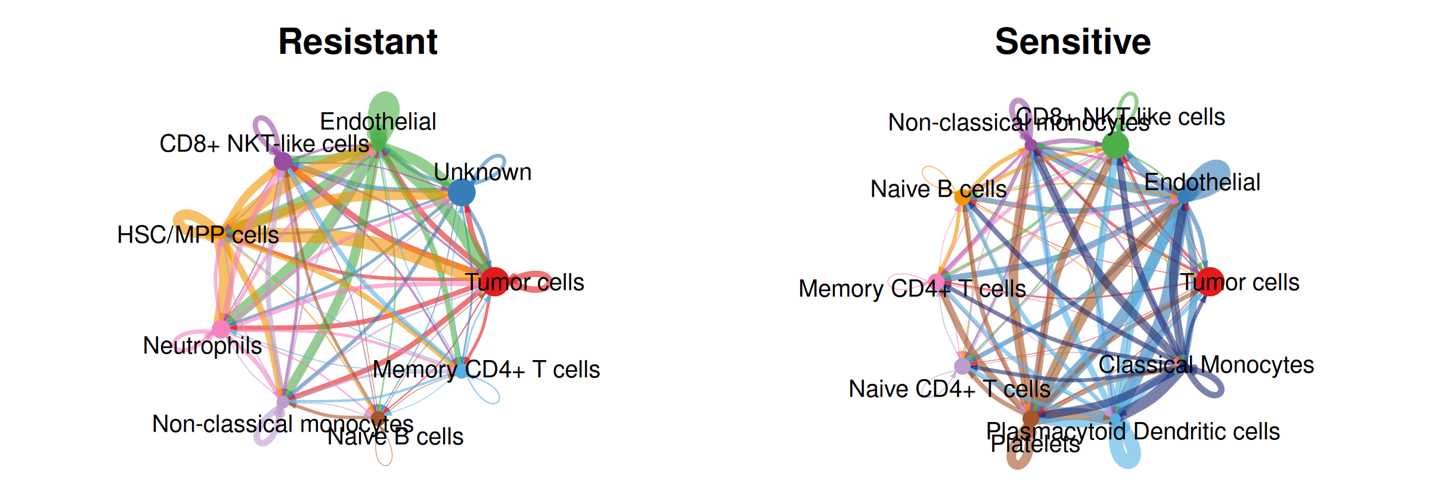
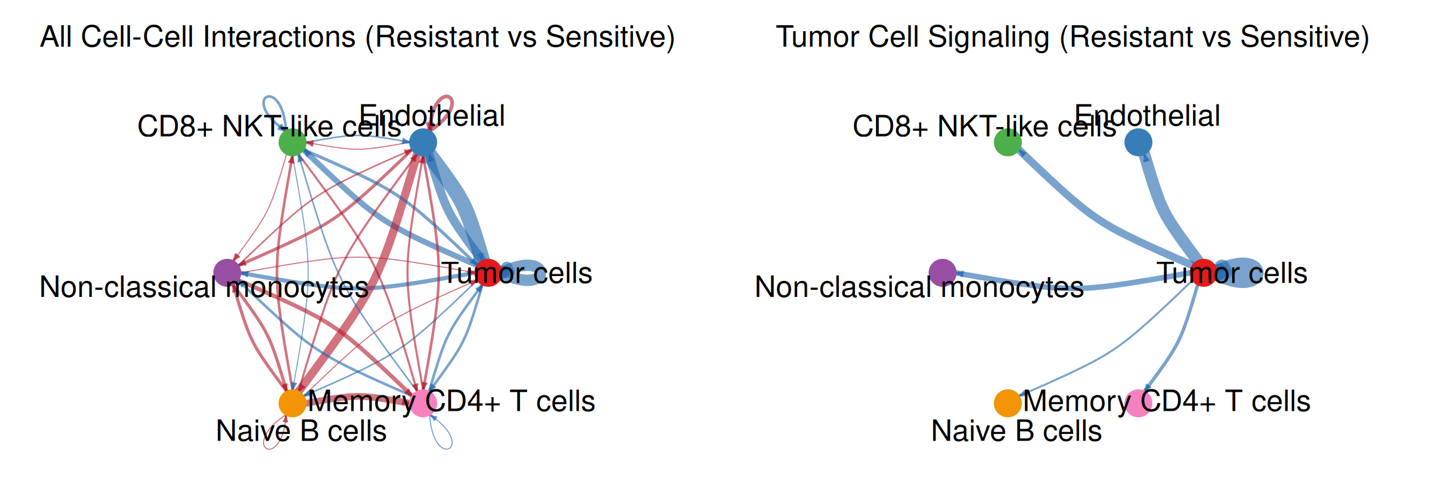
Two complementary network views are provided within this module: global interaction networks that summarize all significant cell–cell communication events within the tissue, and tumor-centered networks that restrict analysis to interactions where tumor cells act as signal senders or receivers. Together, these analyses enable systematic comparison of communication architecture between drug response conditions and highlight tumor-specific signaling alterations within the spatial microenvironment.
1.4 Differential Ligand-Receptor Interaction Analysis
This part identifies ligand-receptor interactions that differ significantly between resistant and sensitive groups by directly comparing inferred communication probabilities across conditions. Differential interactions are determined using statistical testing to detect ligand–receptor pairs whose signaling strength is significantly altered between response states.
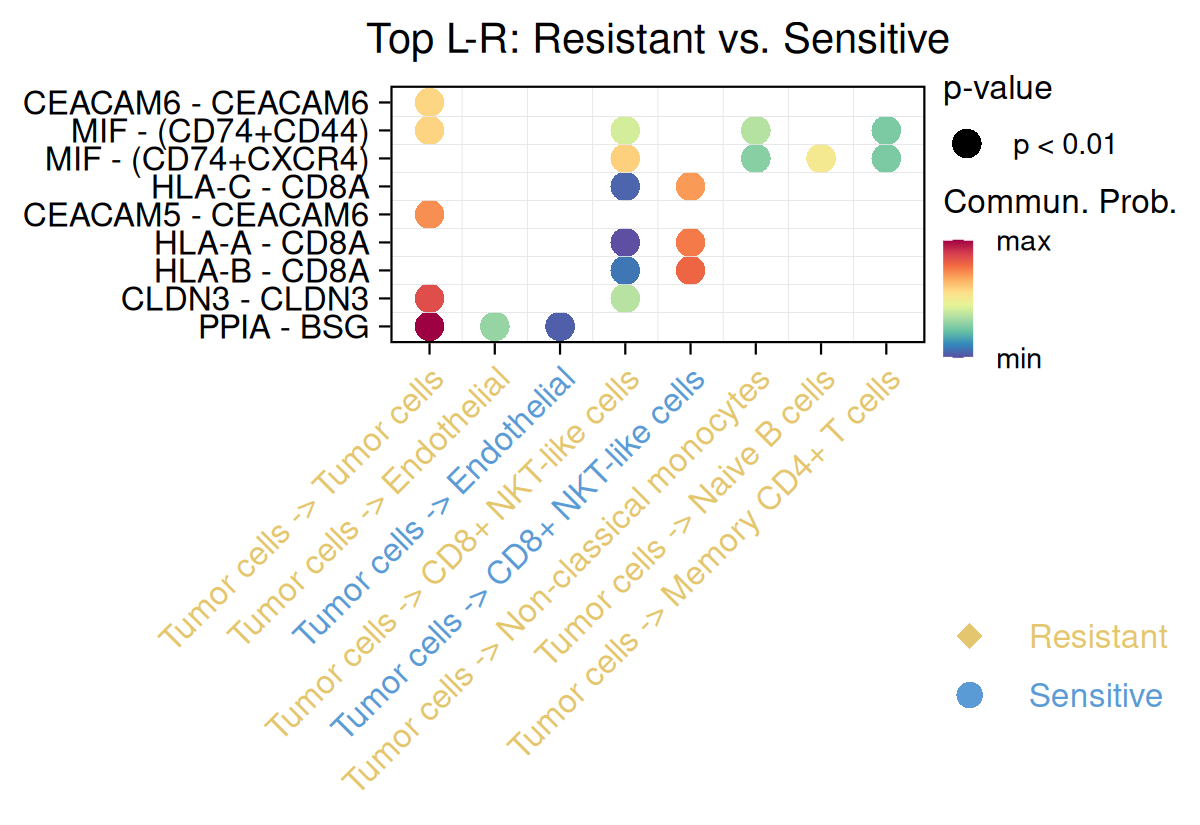
By focusing on condition-specific changes rather than absolute interaction strength, this analysis highlights signaling axes that may contribute to drug resistance-associated microenvironment remodeling. These results complement the global interaction networks by pinpointing specific ligand-receptor pairs enriched in either resistant or sensitive contexts, facilitating mechanistic interpretation of response-associated communication shifts.
1.5 Spatial Localization of Resistance-Associated Genes
This part maps the expression patterns of representative drug resistance-associated genes onto spatial transcriptomic coordinates within tissue sections. Normalized gene expression values are projected onto histological images to evaluate regional transcriptional enrichment in resistant and sensitive samples separately.
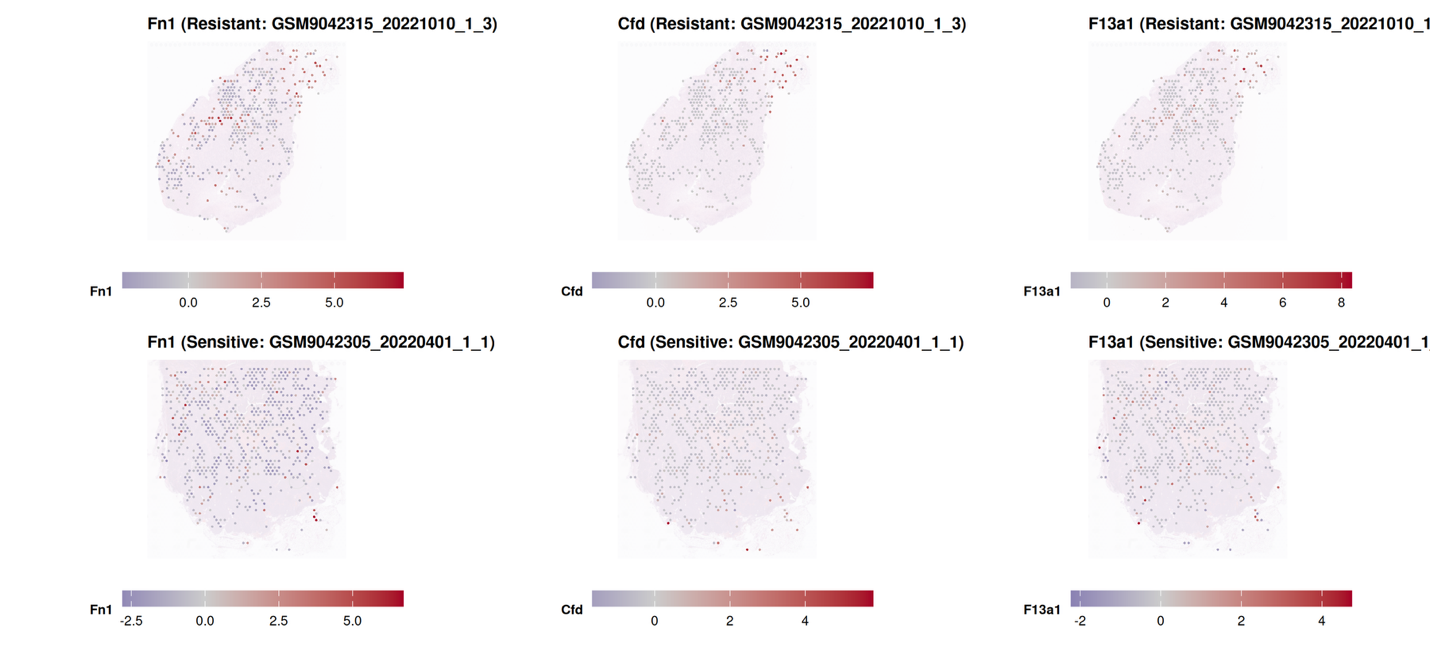
By integrating differential expression results with spatial localization, this analysis allows assessment of whether resistance-associated genes are confined to specific anatomical niches (e.g., tumor core, invasive margins, immune-rich regions) or broadly distributed across the tissue.
2. Transcriptional Module
2.1 Differential Gene Expression Analysis for Identifying Drug Resistance-Related Genes
This section characterizes transcriptional differences between resistant and sensitive tumor cells. Differential expression analysis is performed separately for each dataset using standardized thresholds for statistical significance and fold change. Genes meeting the defined criteria are classified as resistance-associated differentially expressed genes (DEGs).
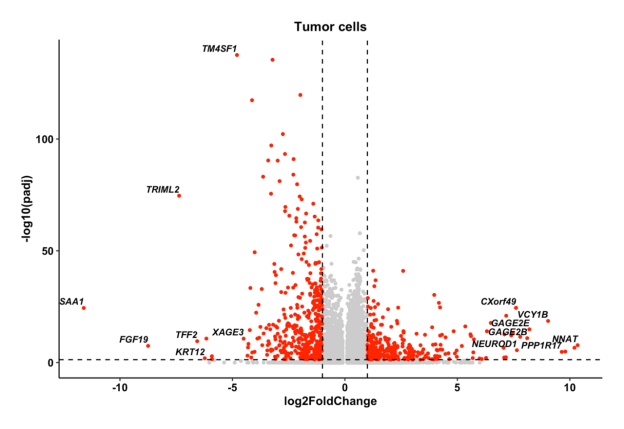
Volcano plots display genome-wide expression shifts, highlighting significantly upregulated and downregulated genes in resistant tumor cells. The top 10 most significant genes are labeled for interpretability. For datasets containing both pre- and post-treatment samples, analyses are presented separately by treatment stage. Complete DEG tables are available in the Download section for further exploration.
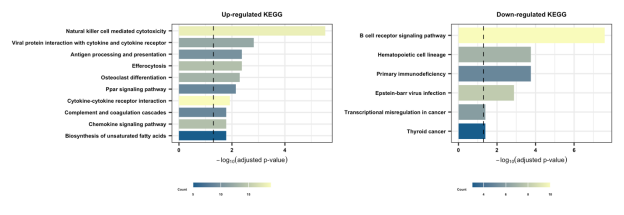
2.2 Functional Enrichment Analysis
To interpret resistance-associated transcriptional programs, significantly regulated DEGs are subjected to pathway enrichment analysis. Enrichment is performed separately for upregulated and downregulated genes in resistant tumor cells, enabling directional interpretation of biological processes.
Section 2.2-1: GOBP
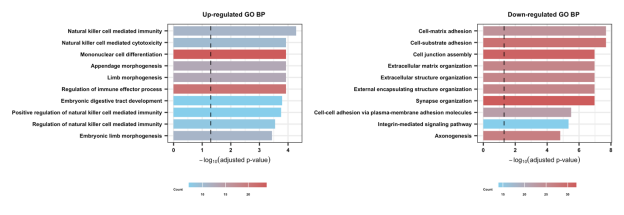
Section 2.2-2: KEGG
Section 2.2-3: Hallmark
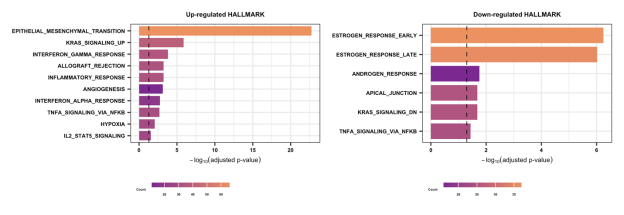
Bar plots summarize the top enriched Gene Ontology Biological Processes (GOBP), KEGG pathways, and Hallmark gene sets. If no pathways are displayed for a category, this indicates that no statistically significant enrichment was detected under the predefined thresholds. These analyses provide functional context for resistance-associated gene expression patterns.
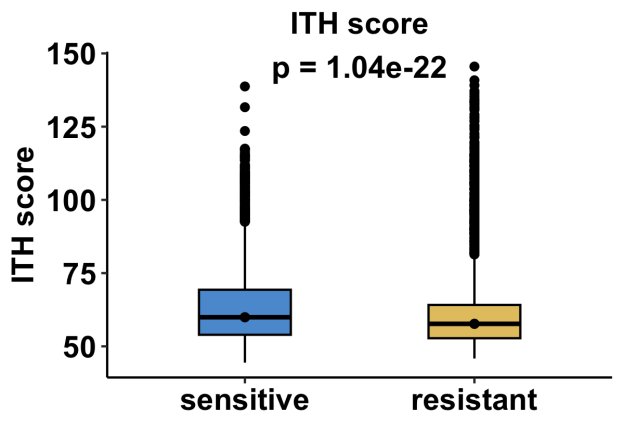
2.3 Intratumoral Heterogeneity (ITH) Analysis
This section evaluates differences in intratumoral heterogeneity between resistant and sensitive tumor cells. ITH scores are computed based on transcriptional variability within malignant cell populations, reflecting the degree of intra-tumor diversity across individual cells.
Or, for datasets with pre and post timepoint:
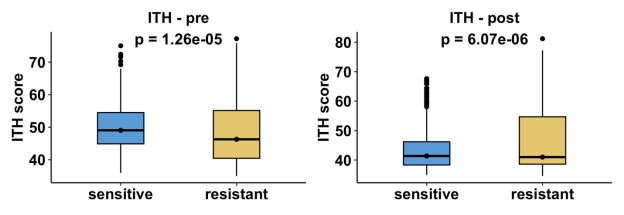
Boxplots illustrate the distribution of ITH scores across response groups. Statistical comparisons are performed using a two-sided non-parametric test. For datasets containing both resistant and sensitive samples at a single treatment stage, results are shown as one comparison panel. For datasets that include both pre-treatment and post-treatment time points, comparisons are presented separately for each treatment stage, resulting in two panels to reflect stage-specific heterogeneity changes. These results provide insight into whether resistance is associated with increased or decreased cellular heterogeneity.
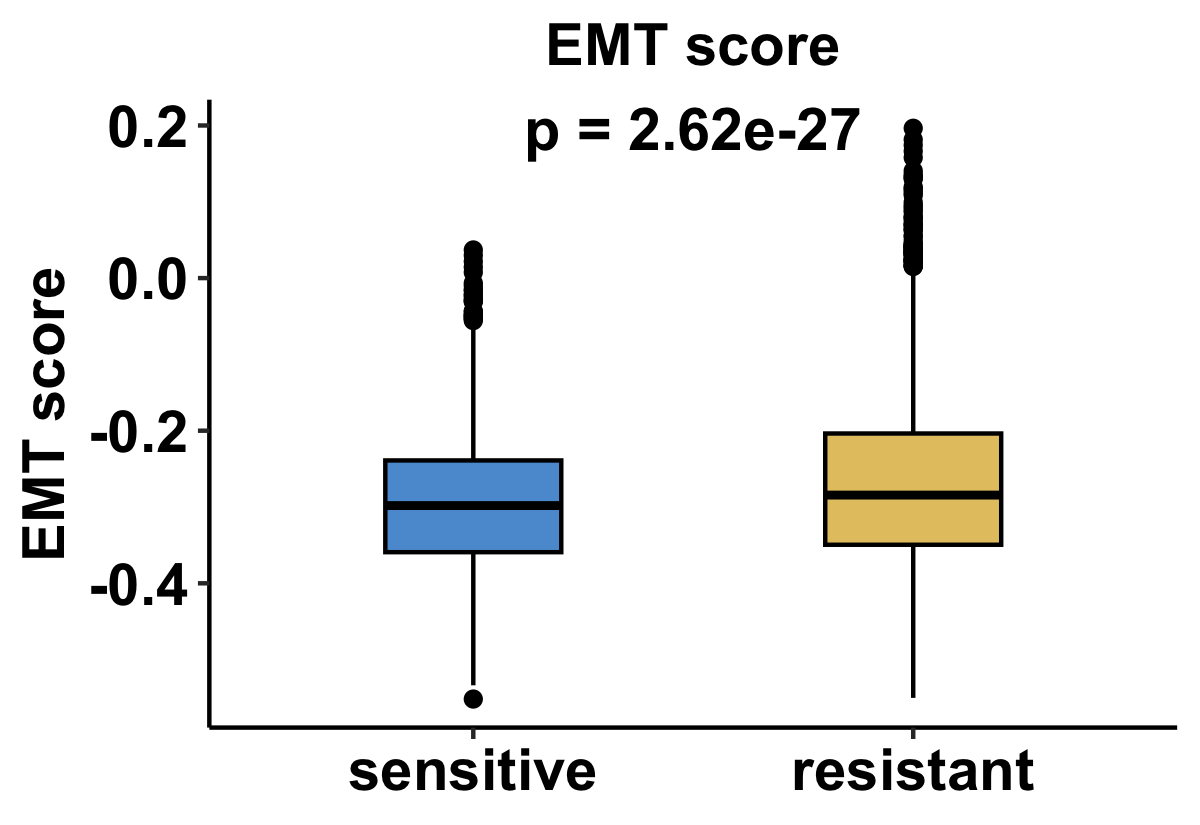
2.4 Epithelial-Mesenchymal Transition (EMT) Analysis
This section assesses epithelial-mesenchymal transition (EMT) activity in tumor cells. EMT scores are calculated using curated EMT gene signatures and quantify the extent of mesenchymal transcriptional programs within malignant cell populations.
Or, for datasets with pre and post timepoint:
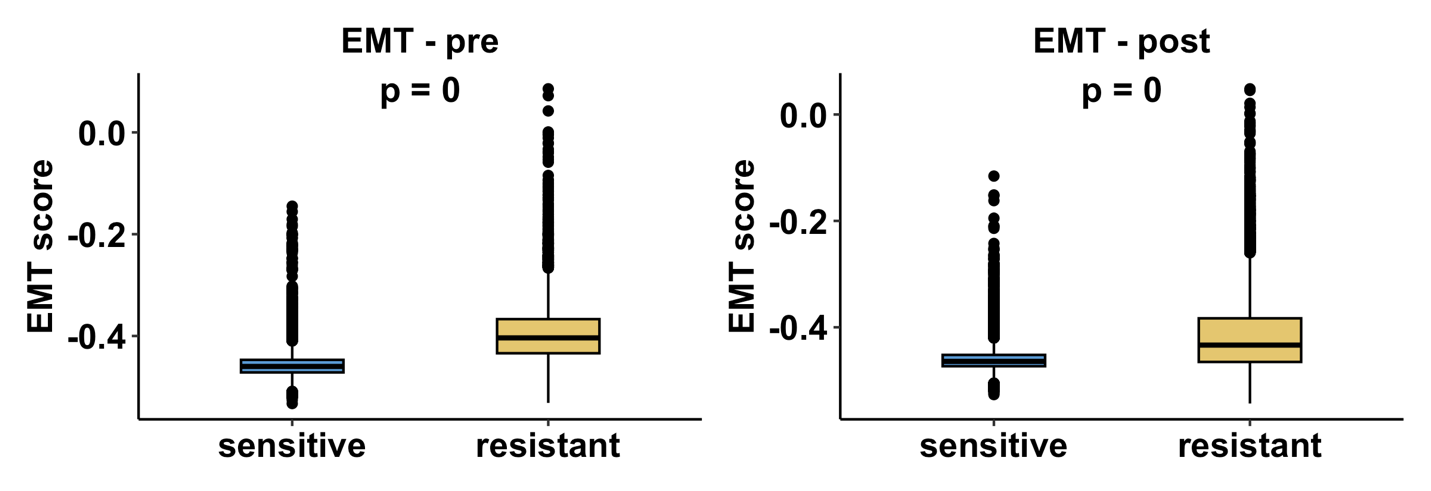
Boxplots illustrate EMT score distributions across resistant and sensitive groups. Statistical significance is evaluated using a two-sided non-parametric test. For datasets containing resistant and sensitive samples at a single treatment stage, results are shown as one comparison panel. For datasets that include both pre-treatment and post-treatment time points, comparisons are presented separately for each treatment stage, resulting in two panels to reflect stage-specific EMT dynamics. This analysis evaluates whether drug resistance is associated with enhanced mesenchymal-like phenotypes across different therapeutic contexts.
2.5 Drug Enrichment Analysis
This section identifies candidate compounds potentially associated with drug resistance-related transcriptional states using Connectivity Map (CMap/LINCS L1000)-based enrichment analysis. Differentially expressed genes (DEGs) from tumor cells are compared against drug-induced gene expression signatures to evaluate transcriptional similarity or reversal effects.
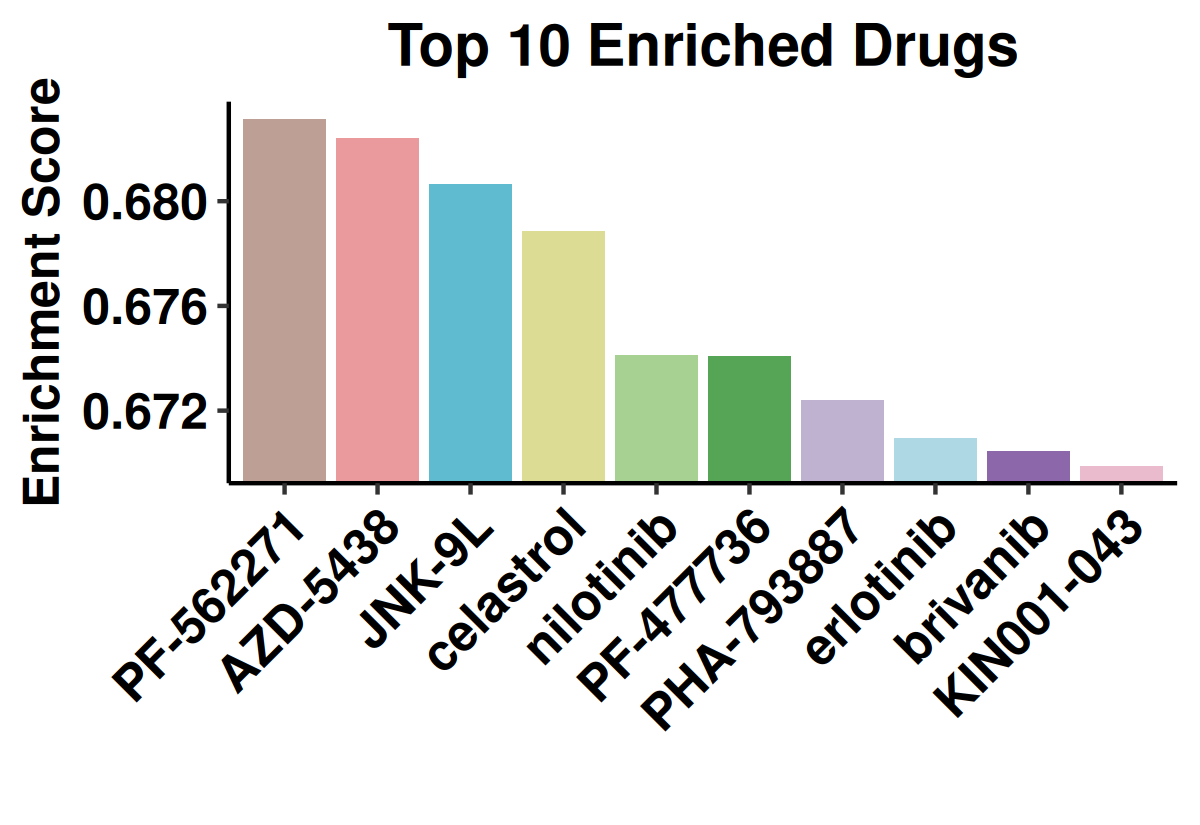
Bar plots display the top 10 significantly enriched compounds ranked by enrichment score. A positive enrichment score indicates that the compound may reverse resistance-associated gene expression patterns (i.e., suppress resistance-upregulated genes and enhance resistance-downregulated genes), whereas a negative score suggests concordant transcriptional effects. Statistical significance is assessed through permutation testing with multiple testing correction. The complete list of significantly enriched compounds is available in the Download section.
3. Regulatory Module
3.1 Resistance-Associated Variant Analysis
This section displays somatic single-nucleotide variant (SNV) profiles derived from single-cell RNA-seq data. Variants are identified using cellSNP-lite and summarized in a cell-by-variant matrix.
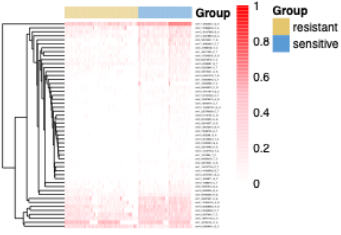
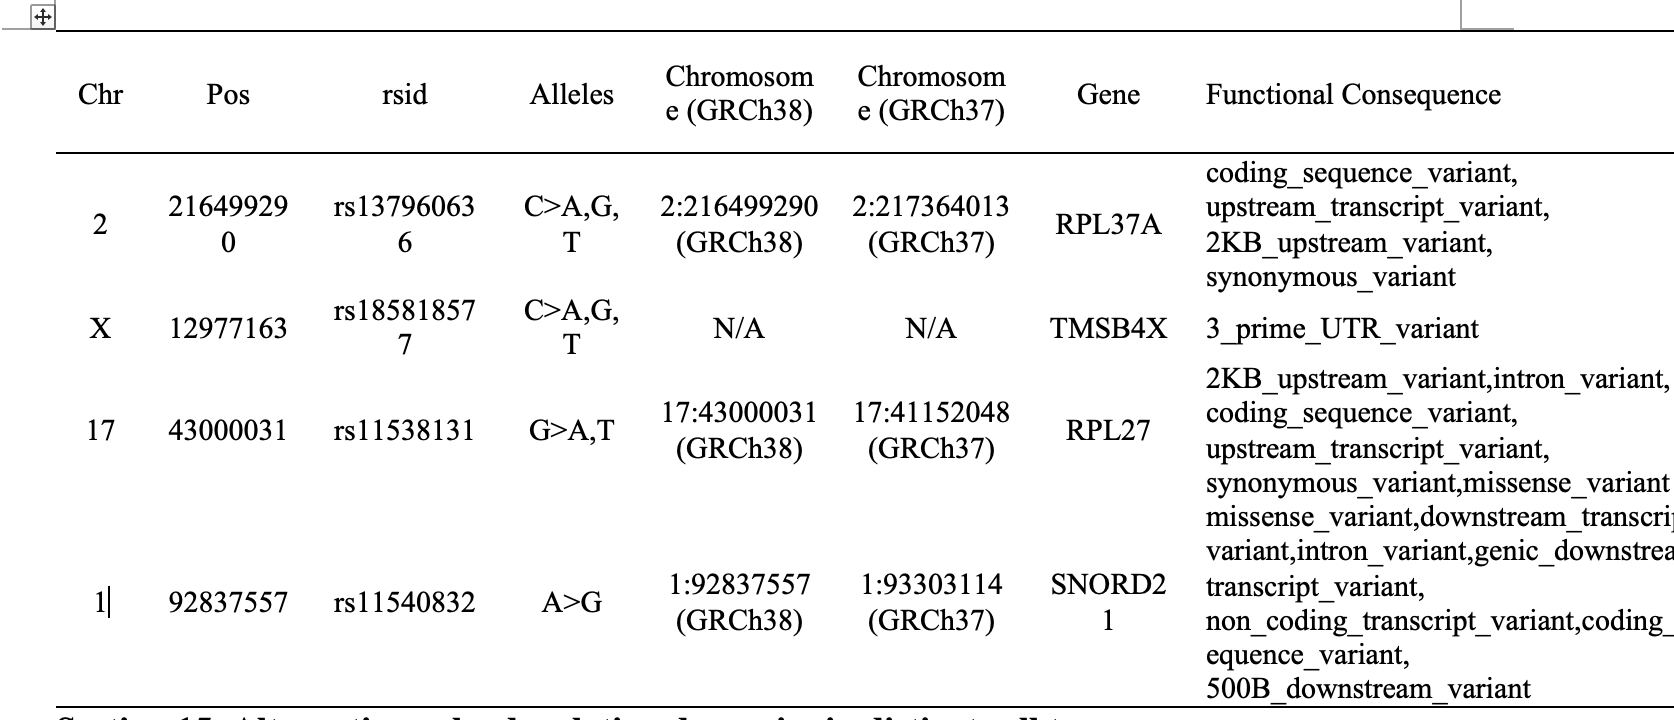
Heatmaps visualize the distribution of selected variants across individual cells in resistant and sensitive groups. Each row represents a variant labeled by genomic position, and each column represents a cell. Accompanying annotation tables integrate dbSNP and ClinVar information, including gene context, functional consequence, protein changes, and clinical classification when available.
3.2 miRNA Enrichment Analysis
This section explores post-transcriptional regulation mediated by microRNAs. Predicted miRNA-gene interactions are obtained from curated databases, and high-confidence regulatory miRNAs are identified for top resistance-associated DEGs.
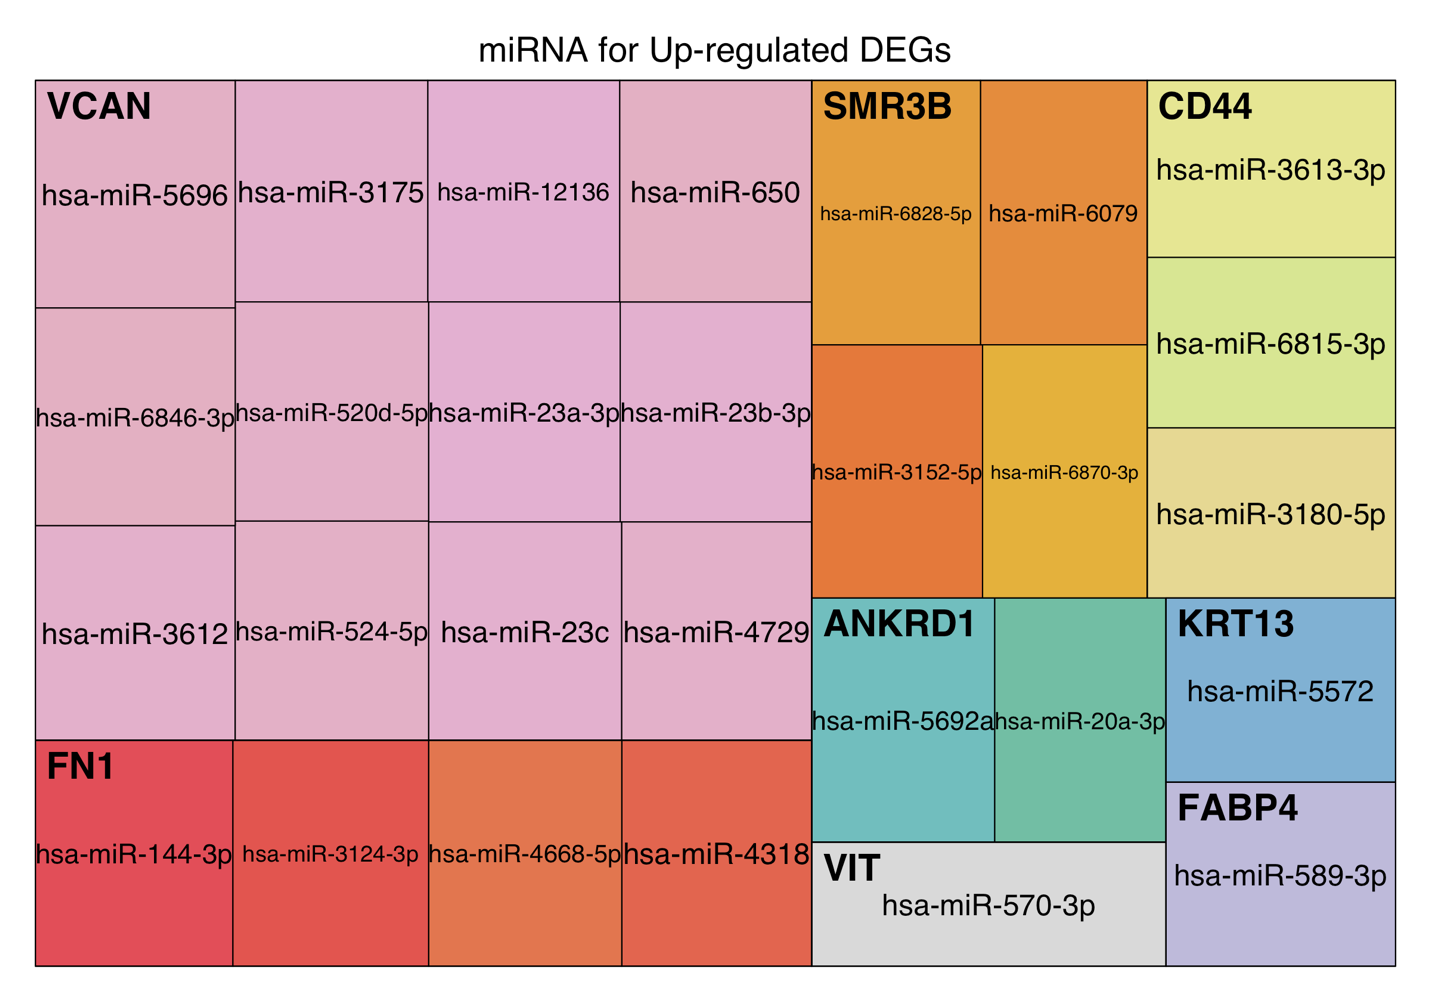
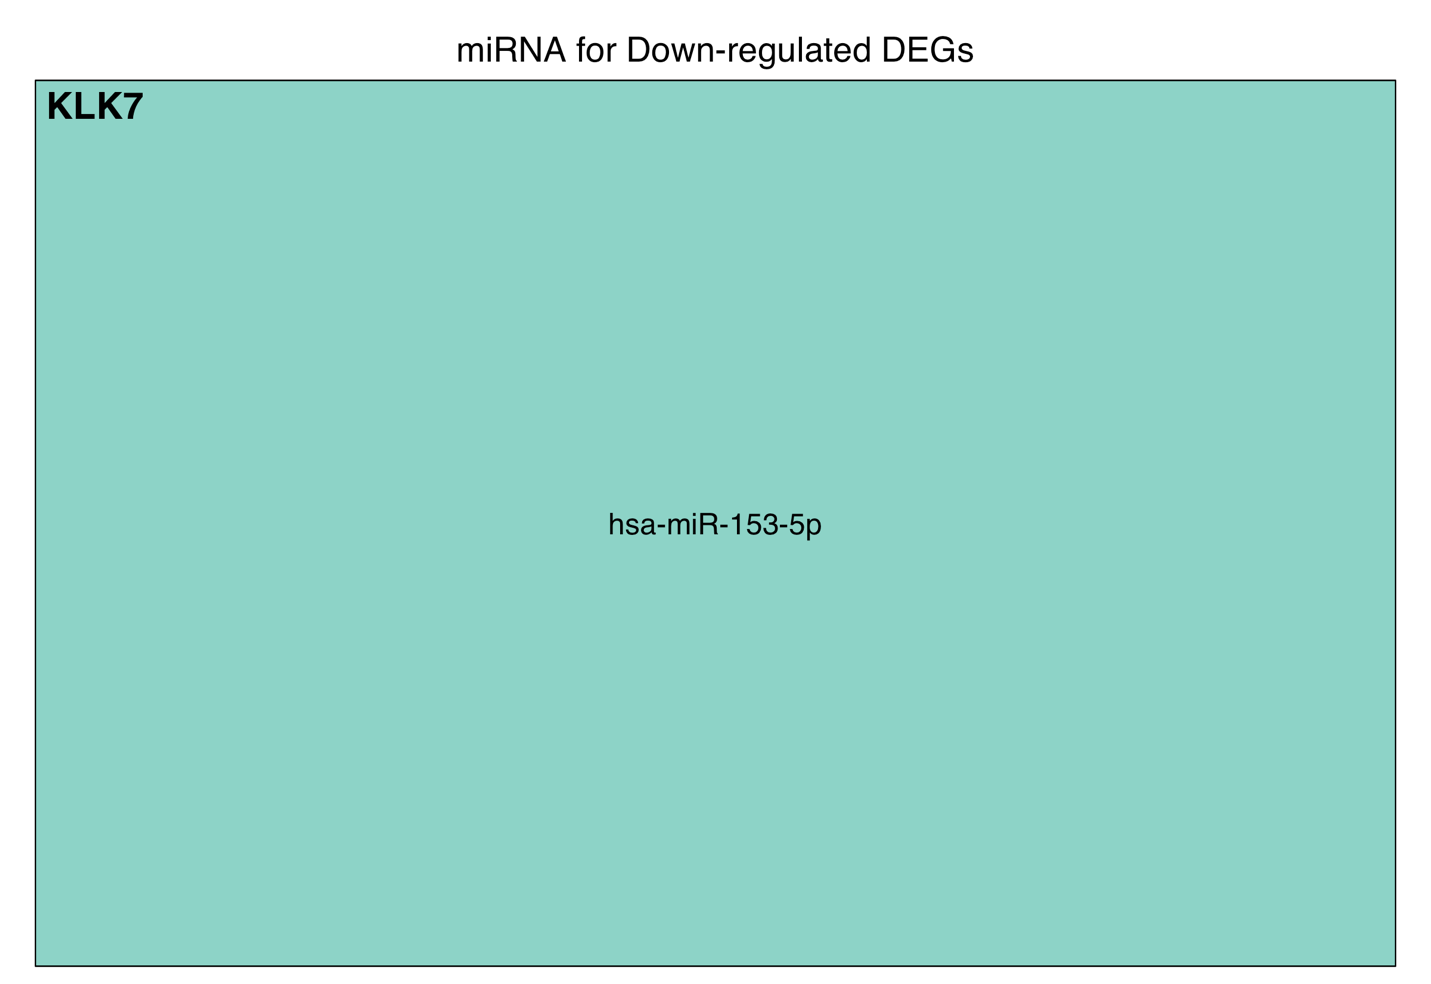
Treemaps visualize predicted miRNAs regulating upregulated and downregulated DEGs separately. Block size corresponds to regulatory confidence score. Only high-confidence interactions are shown. Complete miRNA-gene association tables are available for download.
3.3 RNA-Binding Protein (RBP) Enrichment Analysis
This part investigates potential regulation by RNA-binding proteins. Enrichment analysis is performed to identify RBPs whose known target genes overlap significantly with resistance-associated DEGs.
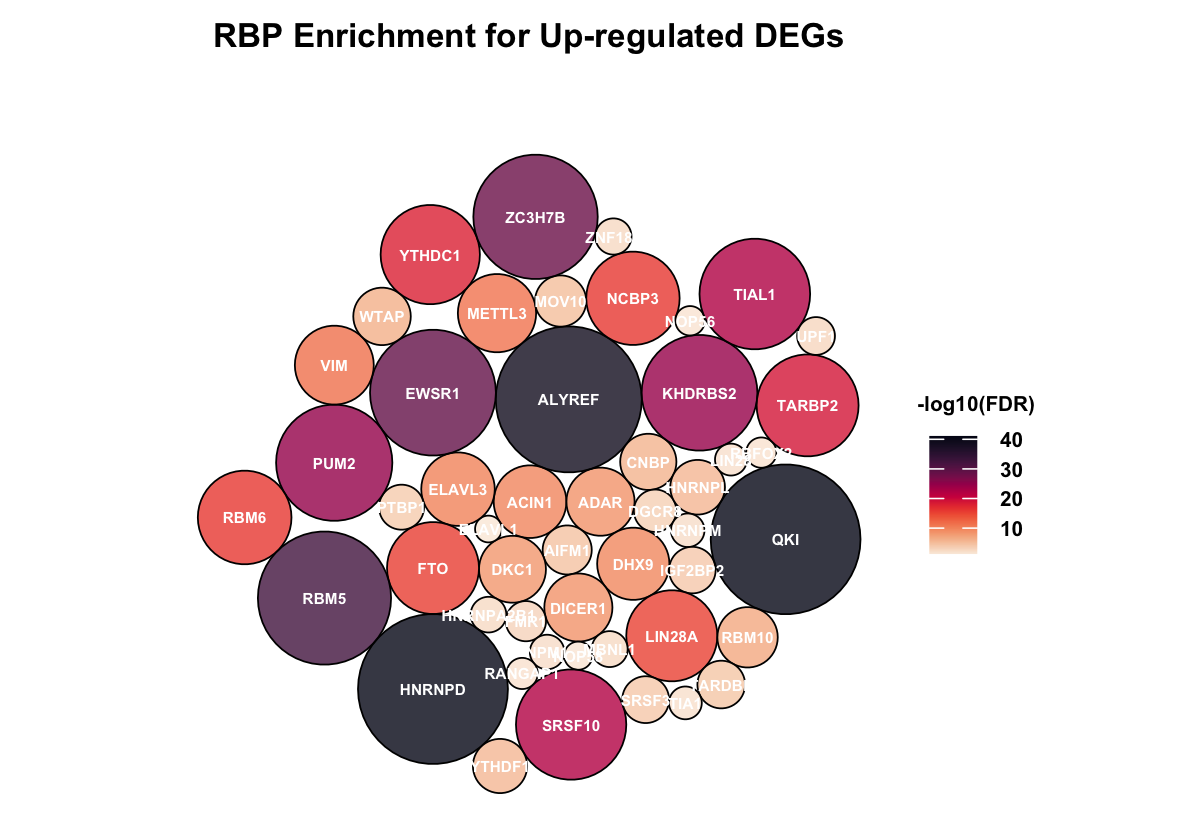
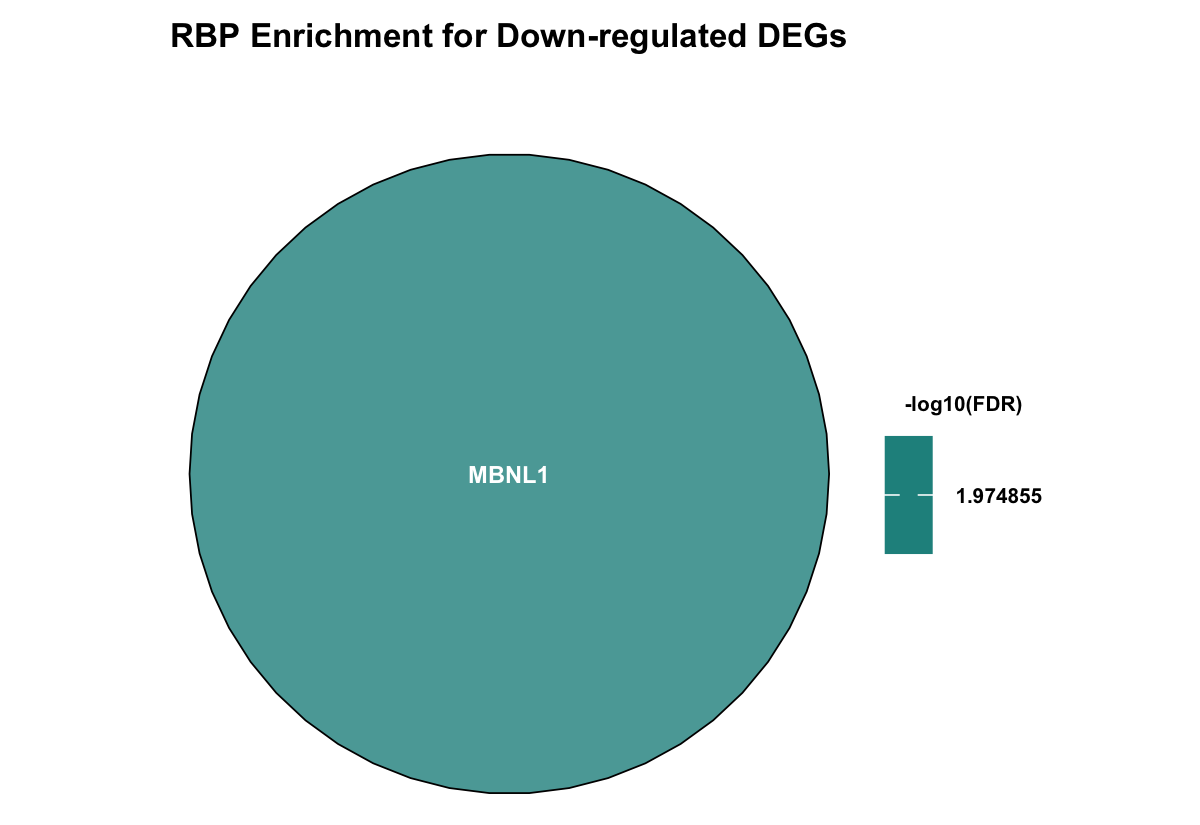
Bubble plots display significantly enriched RBPs for upregulated and downregulated genes separately. Bubble size and color represent statistical significance. This analysis highlights potential RNA-level regulatory mechanisms associated with drug resistance.
3.4 Transcription Factor Motif Enrichment
This section identifies transcriptional regulators associated with resistance-related DEGs. Motif enrichment analysis is performed to detect overrepresented regulatory motifs near gene promoters.
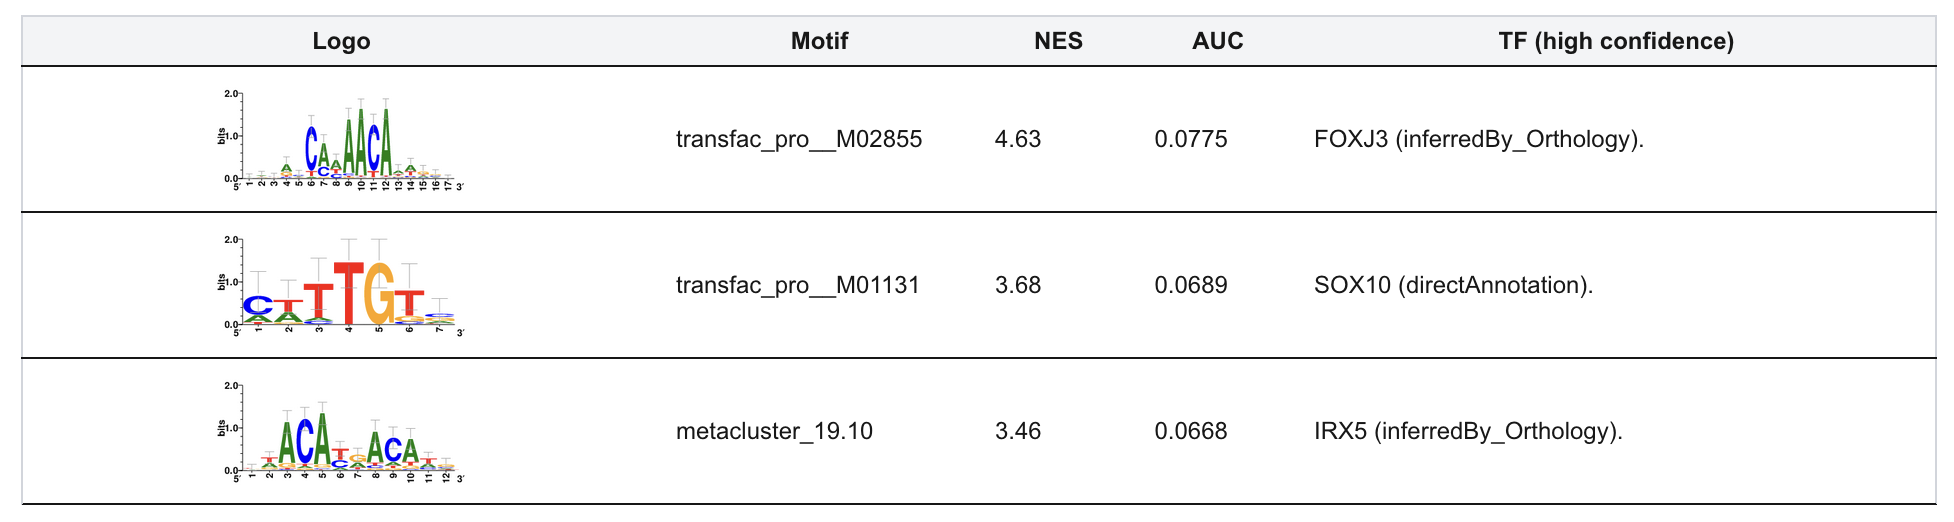
Tables display enriched motifs and their corresponding transcription factors. Upregulated and downregulated genes are analyzed separately. This module provides insight into transcriptional regulatory programs driving resistance phenotypes.
4. Immunogenomic Module
4.1 Alternative Polyadenylation (APA) Dynamics
This section characterizes alternative polyadenylation dynamics at single-cell resolution. PAS usage is quantified with relative expression (RE), which is calculated as:
RE = log2(RDaUTR + 1RDcUTR + 1)
This reflects distal versus proximal polyadenylation site usage.
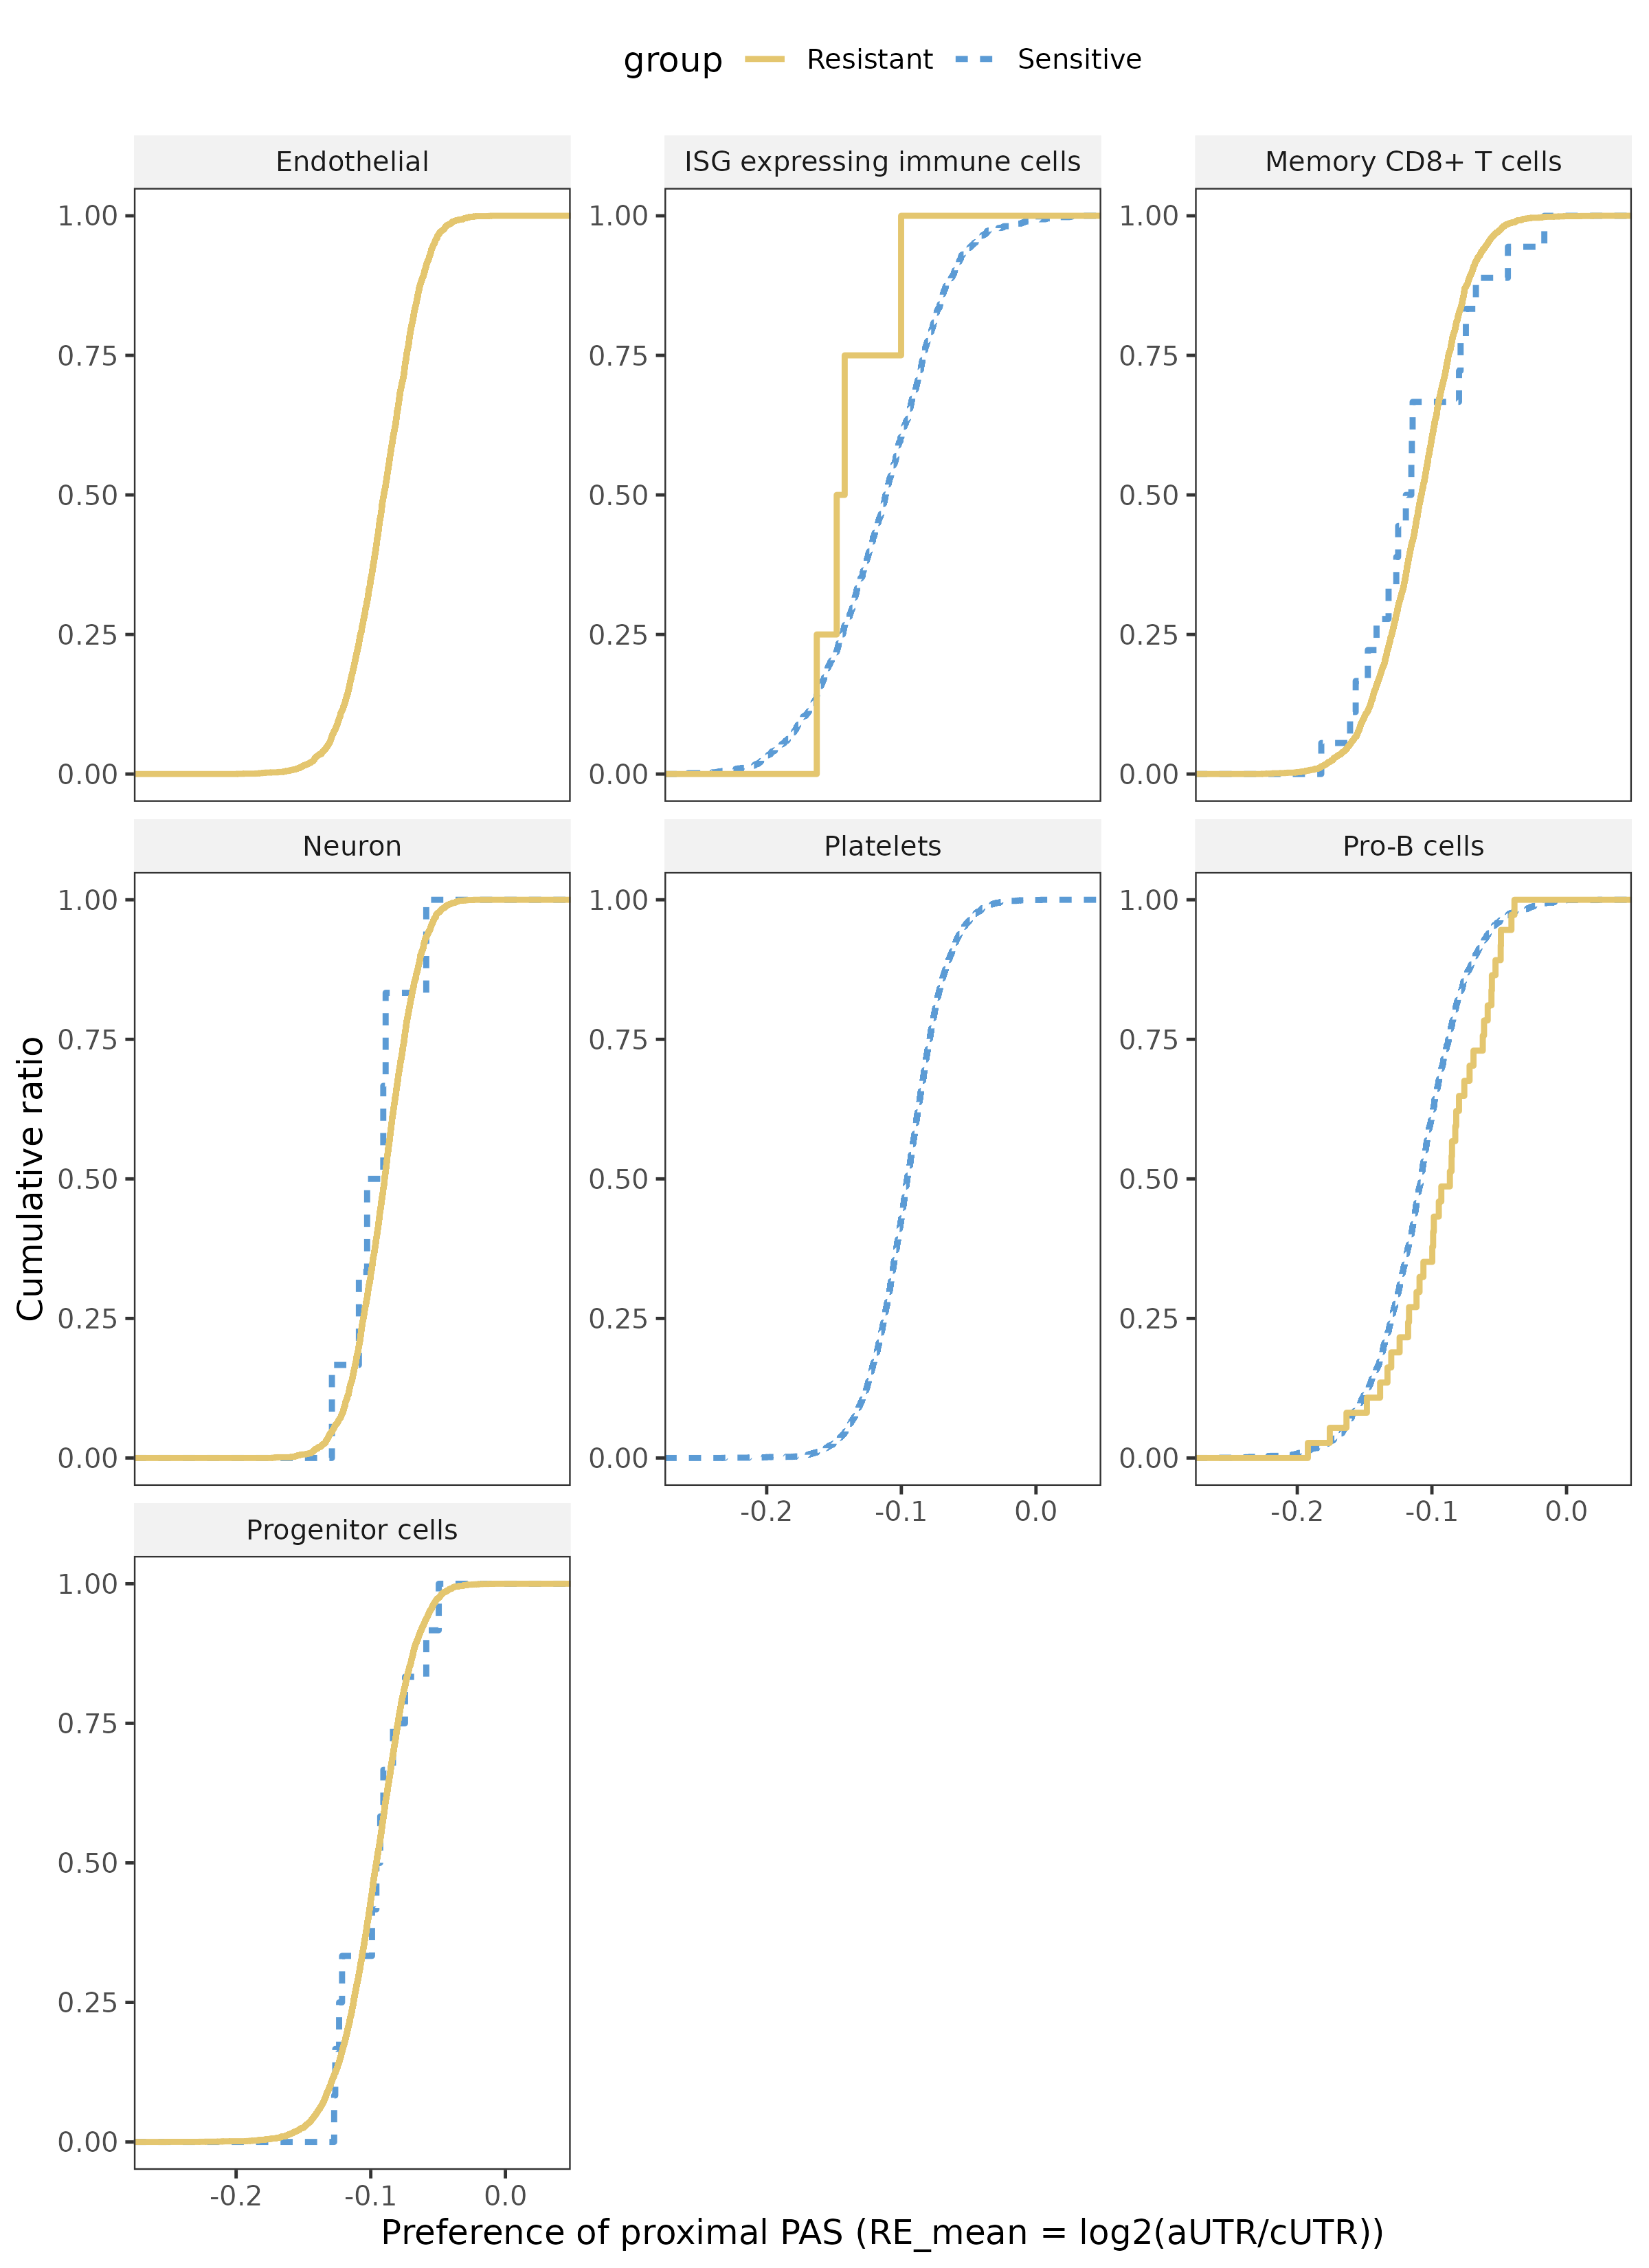
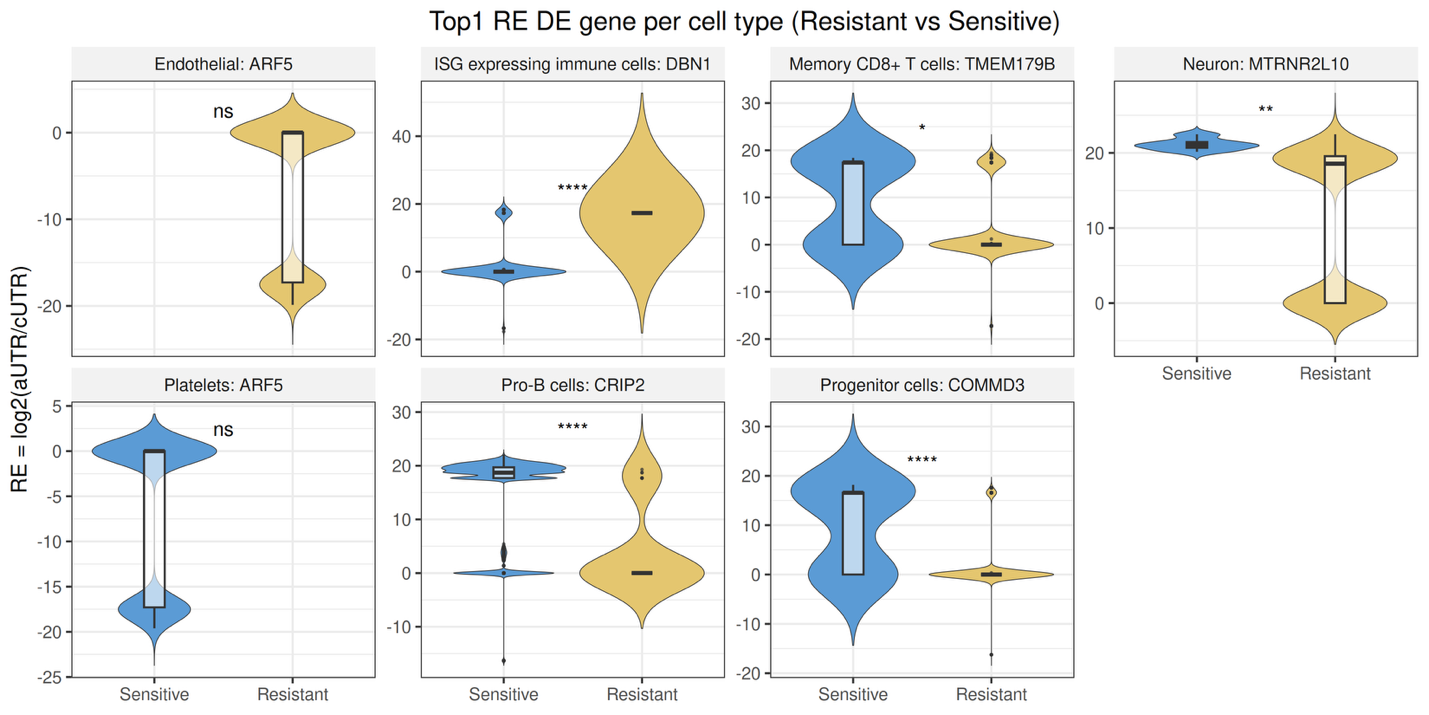
ECDF plots illustrate global APA shifts across cell types between resistant and sensitive groups. Violin plots display the top differentially regulated APA-associated genes per cell type, with statistical testing performed using Seurat::FindMarkers and adjusted p-values. This module reveals cell type-specific post-transcriptional regulation patterns associated with drug resistance.
Differential analysis results for relative expression (RE)-associated genes are also included in this section. Differential testing is performed between resistant and sensitive groups using RE values as quantitative features.
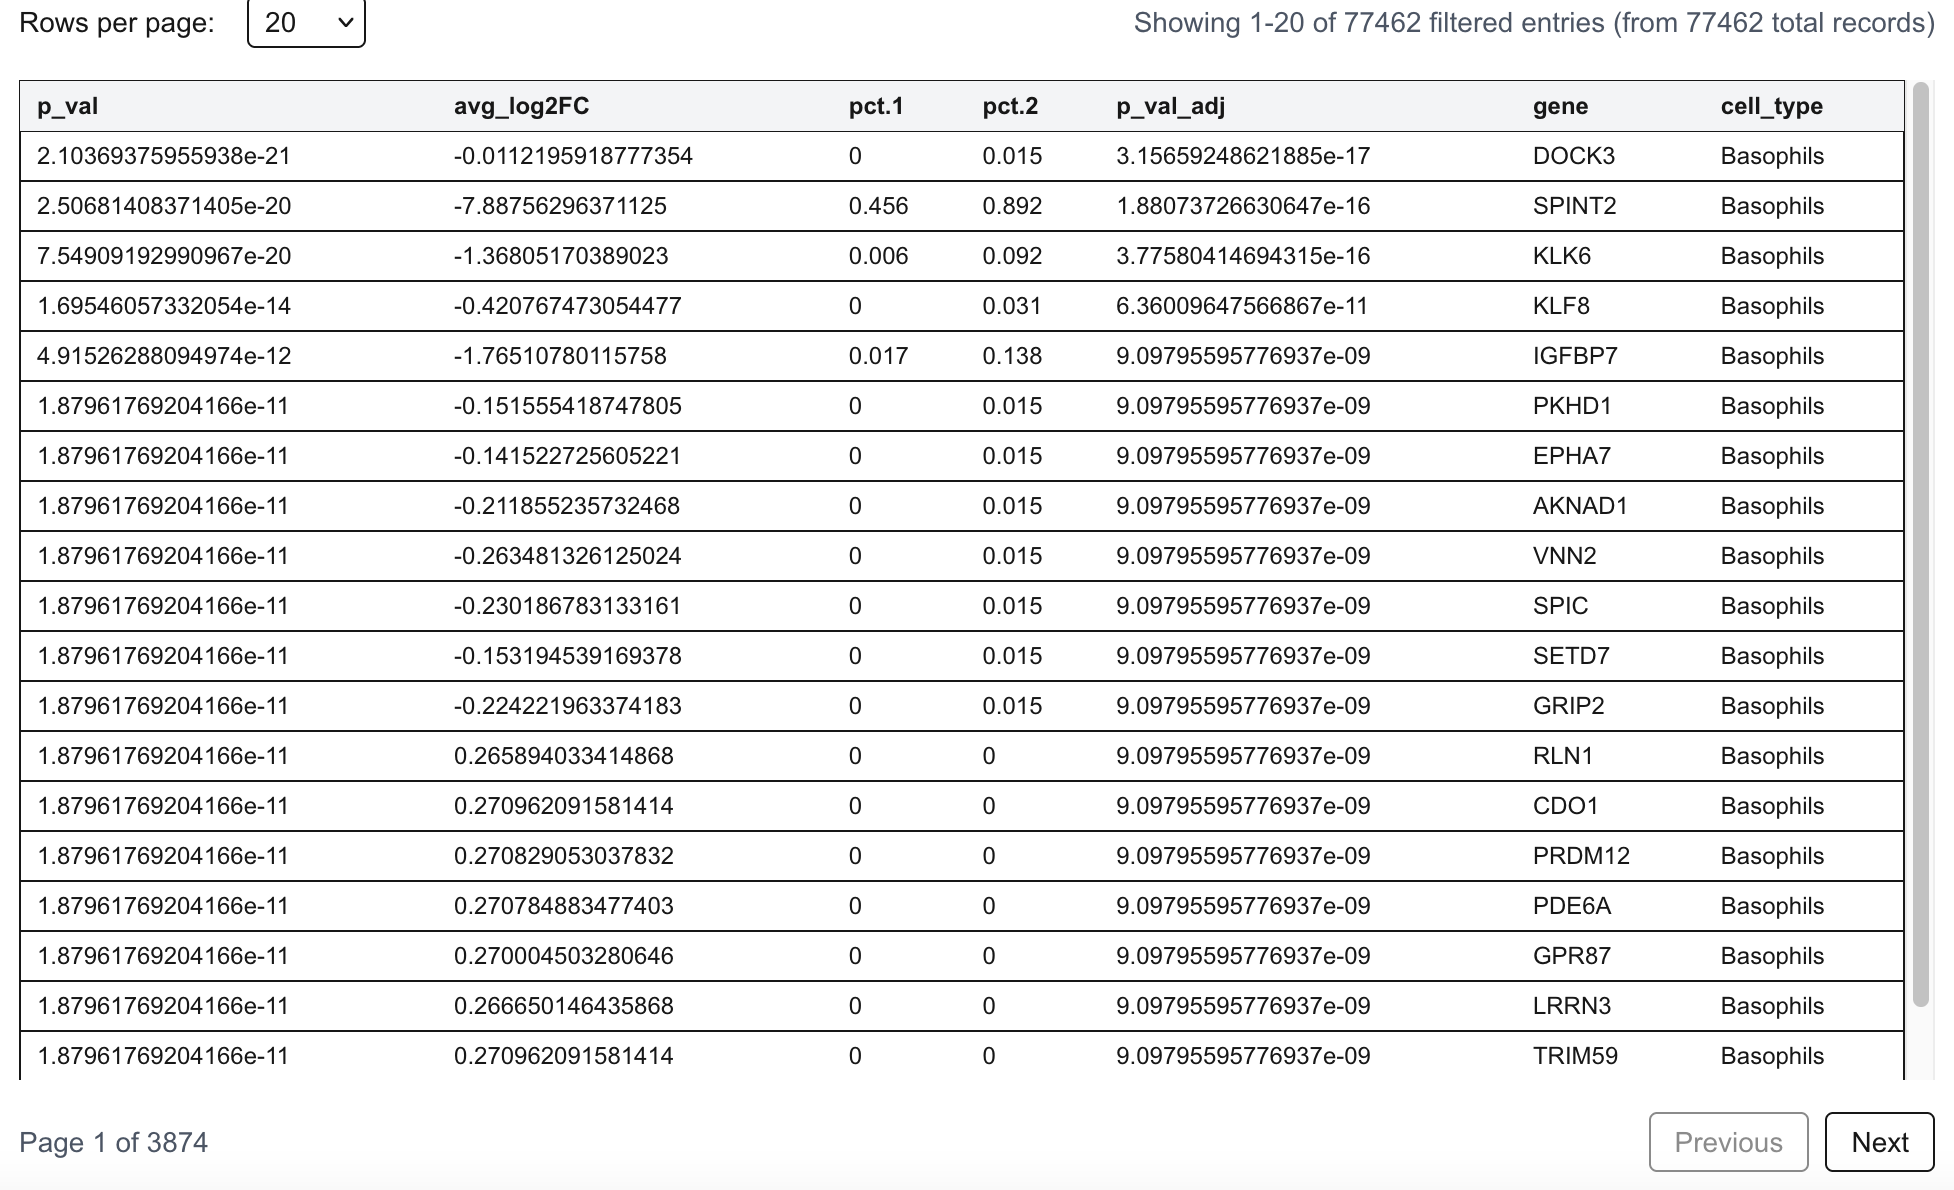
The table displays genes meeting the predefined significance criteria, including an adjusted p-value < 0.05 and an absolute average log2 fold change (|avg_log2FC|) > 0.5. These genes represent significantly regulated alternative polyadenylation events associated with drug response. The complete list of tested genes is available in the Download section.
4.2 HLA Class I Genotyping
This section presents HLA class I genotyping results inferred from scRNA-seq-derived BAM files. Reads mapped to HLA loci are aggregated to generate sample-level genotype predictions.
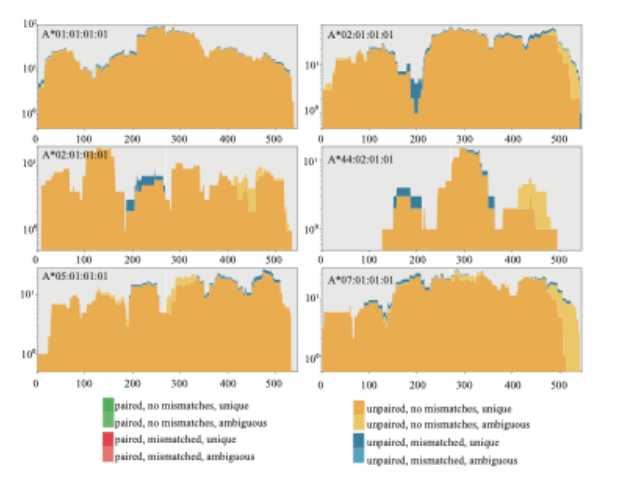
Tables summarize predicted HLA-A, HLA-B, and HLA-C alleles along with supporting read counts and confidence scores. Read depth plots illustrate alignment profiles across allele sequences, enabling evaluation of coverage distribution and genotyping robustness.
| A1 | A2 | B1 | B2 | C1 | C2 | Reads | Objective |
|---|---|---|---|---|---|---|---|
| A*24:02 | A*02:01 | B*07:02 | B*15:02 | C*07:02 | C*07:04 | 84 | 81.732 |
4.3 IPA-Derived Neoantigen Prediction
This section summarizes predicted MHC class I neoantigens derived from tumor-specific intronic polyadenylation (IPA) events. IPA events are identified in malignant cells and filtered against matched non-malignant populations to ensure tumor specificity. Candidate peptide sequences (8–11 amino acids) are generated from novel IPA-induced transcript isoforms.
| SYMBOL | Terminal_exon | IPAtype | IPUI | HLA | Peptide | %Rank |
|---|---|---|---|---|---|---|
| COL17A1 | chr10:104053839-104053919 | Composite | 0.313 | HLA-B*51:01 | IPHSFIHLI | 0.001 |
| TAMALIN | chr12:52007265-52008369 | Composite | 0.561 | HLA-A*31:01 | KVRPPPAFR | 0.001 |
| COPS5 | chr8:67056974-67057379 | Composite | 0.076 | HLA-A*24:02 | TYPKVTFFF | 0.002 |
| COL17A1 | chr10:104053839-104053919 | Composite | 0.313 | HLA-A*24:02 | LYSFIPHSF | 0.003 |
| MYO1C | chr17:1468838-1469530 | Composite | 0.639 | HLA-A*24:02 | LYLPRSALF | 0.003 |
| ATMIN | chr16:81036206-81036814 | Composite | 0.021 | HLA-A*31:01 | RSWEPRVRR | 0.003 |
The table reports gene of origin, genomic coordinates of IPA-associated terminal exons, IPA classification and usage strength (IPUI), matched HLA allele, predicted peptide sequence, and binding affinity percentile rank (%Rank) calculated using NetMHCpan. Peptides with low %Rank values indicate strong predicted binding affinity and represent high-confidence neoantigen candidates.
4.4 Structural Modeling of Neoantigen-MHC Complexes
This section presents three-dimensional structural models of predicted neoantigen-MHC class I complexes. For each peptide-HLA pair, structural prediction is performed using AlphaFold2-Multimer, followed by visualization in PyMOL.
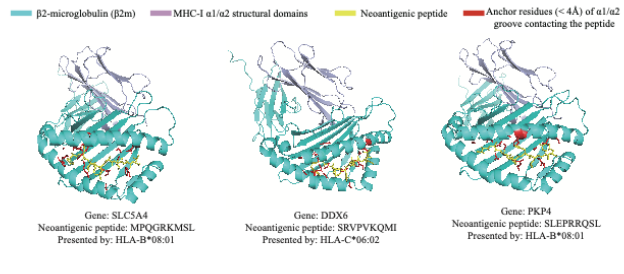
The rendered structures illustrate peptide positioning within the MHC binding groove and highlight key structural elements such as α1/α2 domains and anchor residue interactions. These models provide structural context for evaluating the feasibility of antigen presentation and potential immune recognition.
Copyright 2025-Present - University of Florida